Unlock the Keys to Smarter Real Estate Investments
This interactive dashboard is packed with insights to help you identify profitable rental markets and spot emerging trends before they hit the headlines.
What’s Included?
Our rental data is updated annually and broken down by county for easy, targeted research. Here’s what you’ll get:
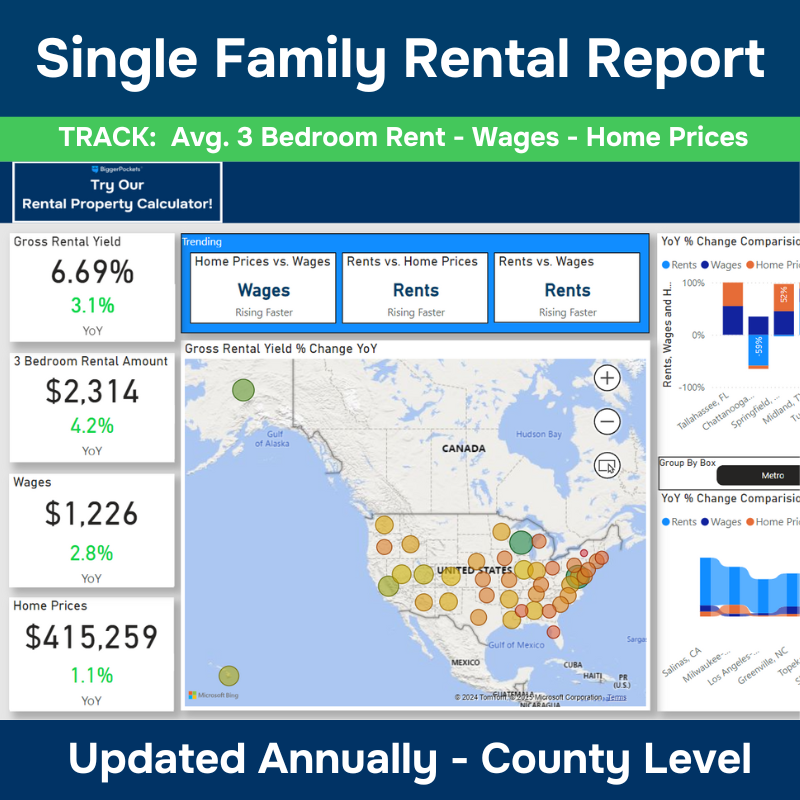
- Gross Rental Yields — See investment property returns, with a breakdown by county.
- Average 3-Bedroom Rental Amounts — Find out how much rental income you can expect for a typical family home in any county.
- Median Home Prices — Track property values across the state to find areas where home prices are rising (or falling).
- Wages vs. Home Prices — Discover if home prices are climbing faster than wages, which can impact rental demand.
- Rents vs. Home Prices — See if rental rates are keeping up with property values to gauge investment potential.
- Rents vs. Wages — Learn if wages are keeping pace with rising rental costs, giving you insight into affordability trends.
- Searchable Dashboard — Quickly search by county to pinpoint the areas that fit your investment strategy.
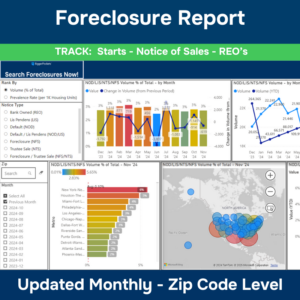
- Statewide Heat Map — Get a visual snapshot of Gross Rental Yield % Change Year-Over-Year to easily identify the hottest (and coolest) rental markets.
Why Subscribe?
Whether you’re a seasoned investor or just getting started, this data helps you:
- Identify High-Yield Areas — Find counties with the best return on investment.
- Track Market Trends — Stay ahead of the curve by spotting shifts in rental yields, wages, and home prices.
- Make Smarter Decisions — Use real data to determine where your money will work hardest for you.
Exclusive Pricing for Equity Trust Clients
Comprehensive, state-wide rental data reports typically retail for $100+ annually. But as an Equity Trust client, you can subscribe for just $19.95 per year and gain full access to the interactive dashboard.
It’s time to make more informed investment decisions.